One place. Nine turning points.
As control
spread,
space narrowed.
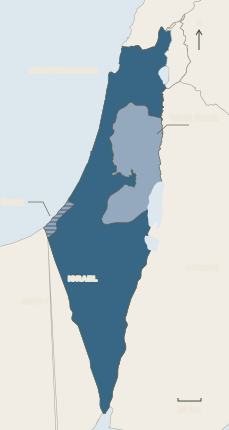
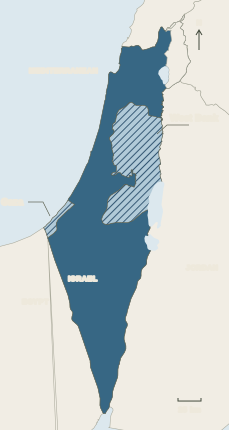
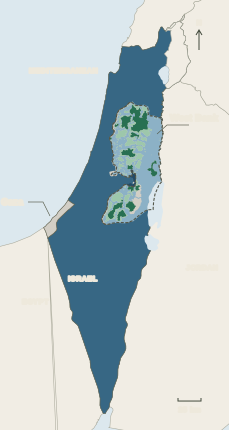
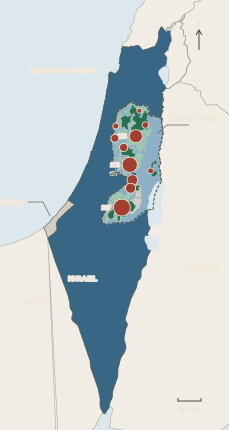
Follow one fixed map. Red records the reach of Israeli state control and settlements; green shows the space outside that reach. Behind every change are Palestinian homes, journeys and lives.
01 / 09PALESTINIAN COMMUNITIES
1945
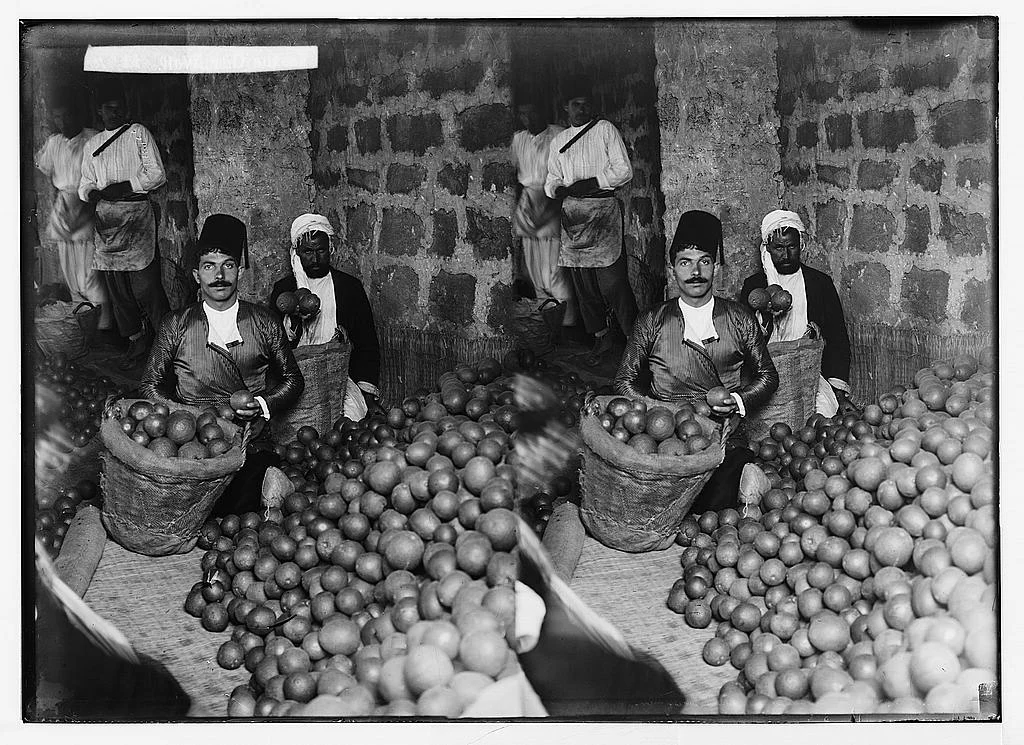
A land of towns, villages and families
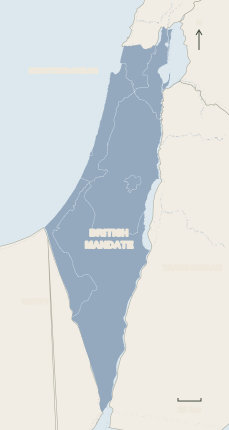
Palestinian Arabs lived throughout Mandatory Palestine. The full map begins green to show the geographic frame, not exclusive ownership or sovereignty. The individual maps below document the land records in more detail.
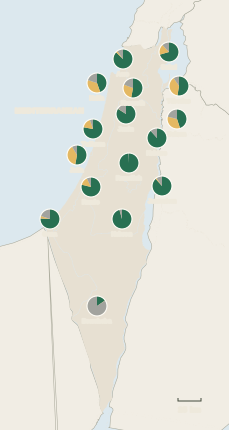
About two in three residents of British Mandate Palestine in the mid-1940s were Palestinian Arabs.
Read the record ↗Second source ↗
ONE FIXED GEOGRAPHIC FRAMEMandatory Palestine
PALESTINIAN ARABS WERE≈⅔of residents in British Mandate Palestine in the mid-1940s
GAZA · ENLARGEDDETAIL
1949–1967EGYPTIAN ADMINISTRATIONGreen interior
The ≈⅔ figure is a share of people, not land. Green shows the Mandate area, not ownership or sovereignty.
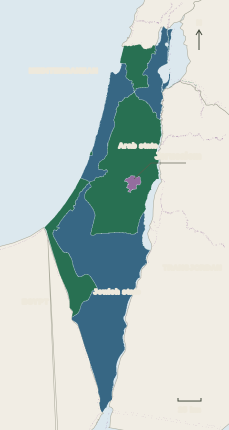
Read the colours by date. The 1947 red shape is a proposal. The 1949 red shape is territorial control. Hatching marks occupation; later red in Area C marks administration, not sovereignty. Palestinians live in red and green areas alike.
The map is not the people. It cannot show every home lost, journey into exile or restriction on daily life. The dated facts and the maps below provide that evidence. Sources and method ↗